Stock API Charts Need Complete Downloads and Explicit Data Gaps
TickDB Research ·
Stock API Charts Need Complete Downloads and Explicit Data Gaps
Summary: A stock chart can look convincing even when its history is incomplete. A stock API supplies records under specific retrieval and aggregation rules; your application must finish the download and preserve missing observations. This article explains pagination, absent candles, and a small Python example that keeps an unknown price from becoming a false market move.
A stock API is a programmatic interface for retrieving stock-related data. For a historical chart, that often means requesting bars: records containing open, high, low, close, and volume for an interval. Those records can power chart viewers, research dashboards, and historical comparisons. They do not, by themselves, establish that every part of your requested window has been downloaded.
Consider a chart that has prices before and after a missing minute. Replacing the missing price with zero invents a collapse. Repeating the previous price creates a flat segment that was never observed. A sound implementation keeps the absence explicit while it determines whether the cause is normal market behavior, a retrieval problem, or a coverage limit.
A successful response may contain only part of the history
The first completeness check belongs in the downloader. An HTTP success means a request succeeded; a paginated endpoint may still have more records to return.
Alpaca's Historical bars documentation gives a concrete example. Its multi-symbol results are ordered by symbol and then timestamp, so the first page can contain only one symbol. The page limit applies across the response, and a short page can still have a continuation token. An application must follow the documented token rather than decide that fewer rows means the download is finished.
That behavior is specific to the endpoint. Other APIs use different retrieval controls. TickDB's Candlestick Data endpoint, for example, exposes a symbol, interval, time bounds, and a record limit. Its documentation caps the limit at 1,000 and says the Free plan cannot specify start or end times. These constraints matter when designing a history browser: access to recent candles does not automatically provide arbitrary historical navigation.
Keep retrieval logic in the provider adapter. Confirm how boundaries and ordering work before splitting a request into time windows. If that behavior is undocumented, treat it as an unresolved integration requirement; guessing how to advance a timestamp can skip records or repeatedly retrieve the same window.
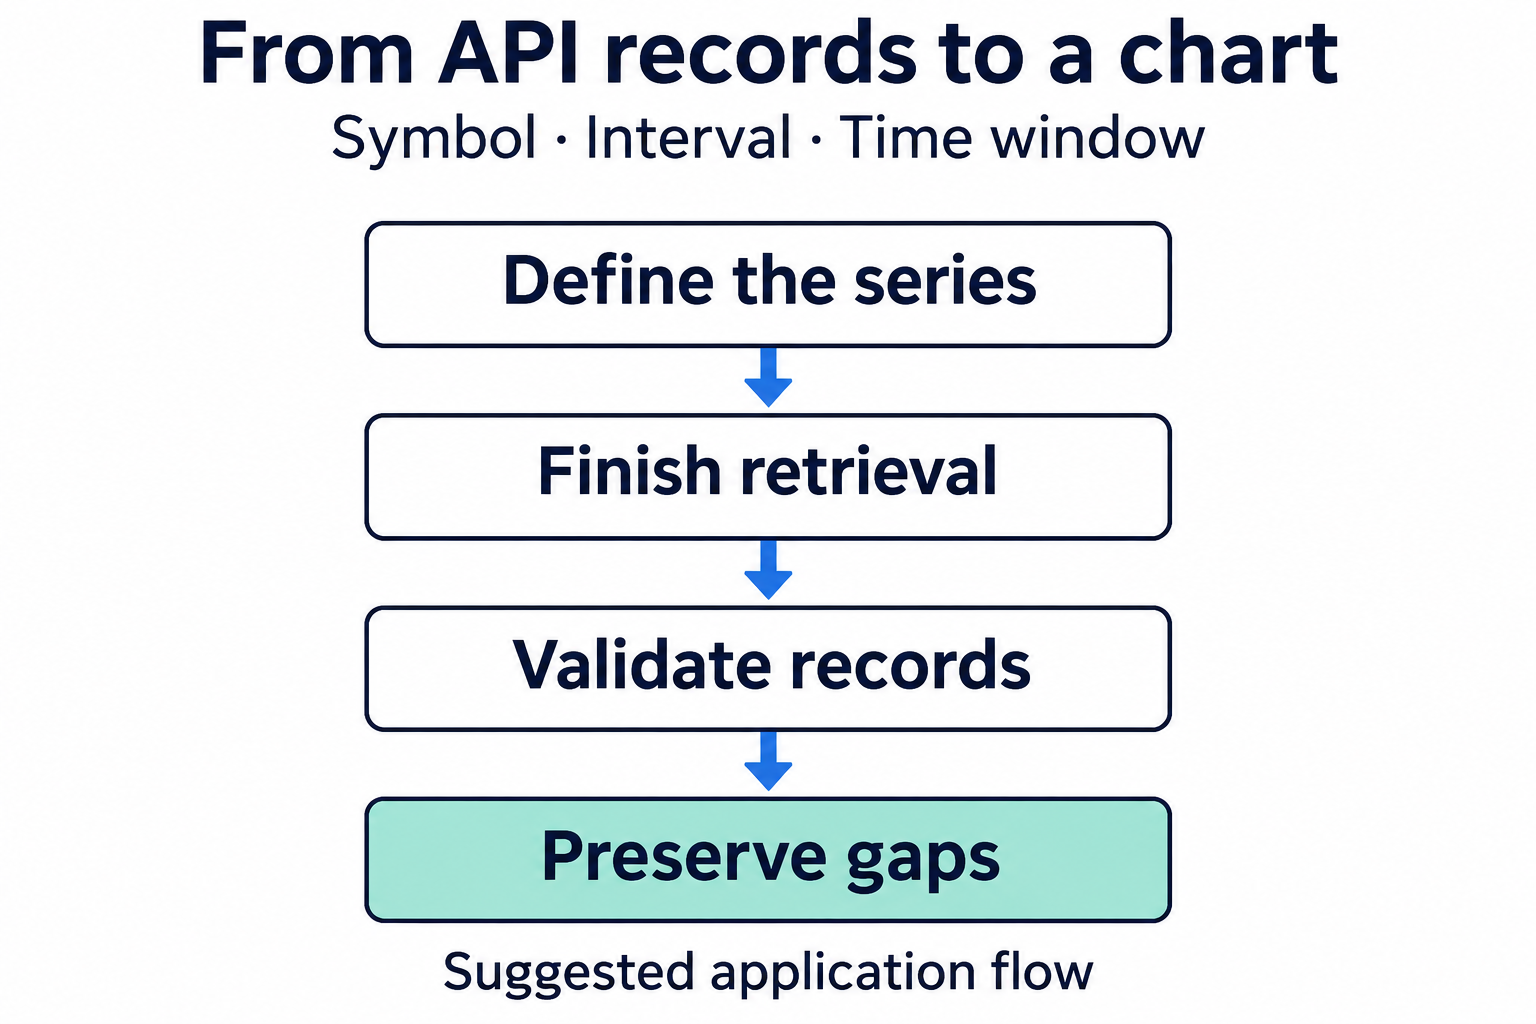
Figure 1. Suggested application flow. Retrieval follows the chosen endpoint's rules; validation and gap handling happen before rendering. This is a design illustration, not a measured system result.
An absent candle does not identify its own cause
Once retrieval has finished, a missing interval still needs interpretation. Databento's Aggregate bars documentation states that an interval without a trade produces no record. Under that convention, an absent bar can be an expected result. It does not establish that the service lost data, and the rule should not be assumed for every provider.
Start with the query context. Was the instrument trading during that period? Does the selected dataset cover the session you want? Does the provider omit intervals without qualifying observations? Did the downloader finish all required requests? These questions distinguish expected absence from an unexplained gap.
An exchange calendar also belongs in this interpretation. Do not generate a continuous minute grid across nights, weekends, and holidays and label every empty slot a failure. Use the calendar and session policy appropriate to the instrument. Keep timestamp conversion separate from session selection, including daylight saving changes.
Bar boundaries need their own check. Databento documents that its daily OHLCV schema follows UTC dates. A daily bucket therefore should not automatically be treated as the exchange-session day your chart intends to show.
Until the cause is established, a useful status is simply “no bar returned.” Labels such as “market closed” or “no trades” make stronger claims and need supporting context.
Keep missing prices separate from derived display values
Suppose a synthetic series has a close of 100.00 at 14:30 UTC, no returned bar at 14:31, and a close of 101.00 at 14:32. The missing slot contains no observed close. It is neither a zero nor proof that the price stayed at 100.00.
For a close-price line, pass an explicit missing value to the chart adapter and configure the renderer to show a break. Some charting systems connect surrounding observations unless told otherwise, so inspect the rendered result as well as the input array. For candlesticks, do not manufacture an OHLC record from a missing slot.
Forward filling can serve a different purpose, such as displaying a last-known value in a dashboard. Preserve its original observation time and mark it as carried forward. Store that derived value separately from the observed series so it cannot silently become a reported trade or candle.
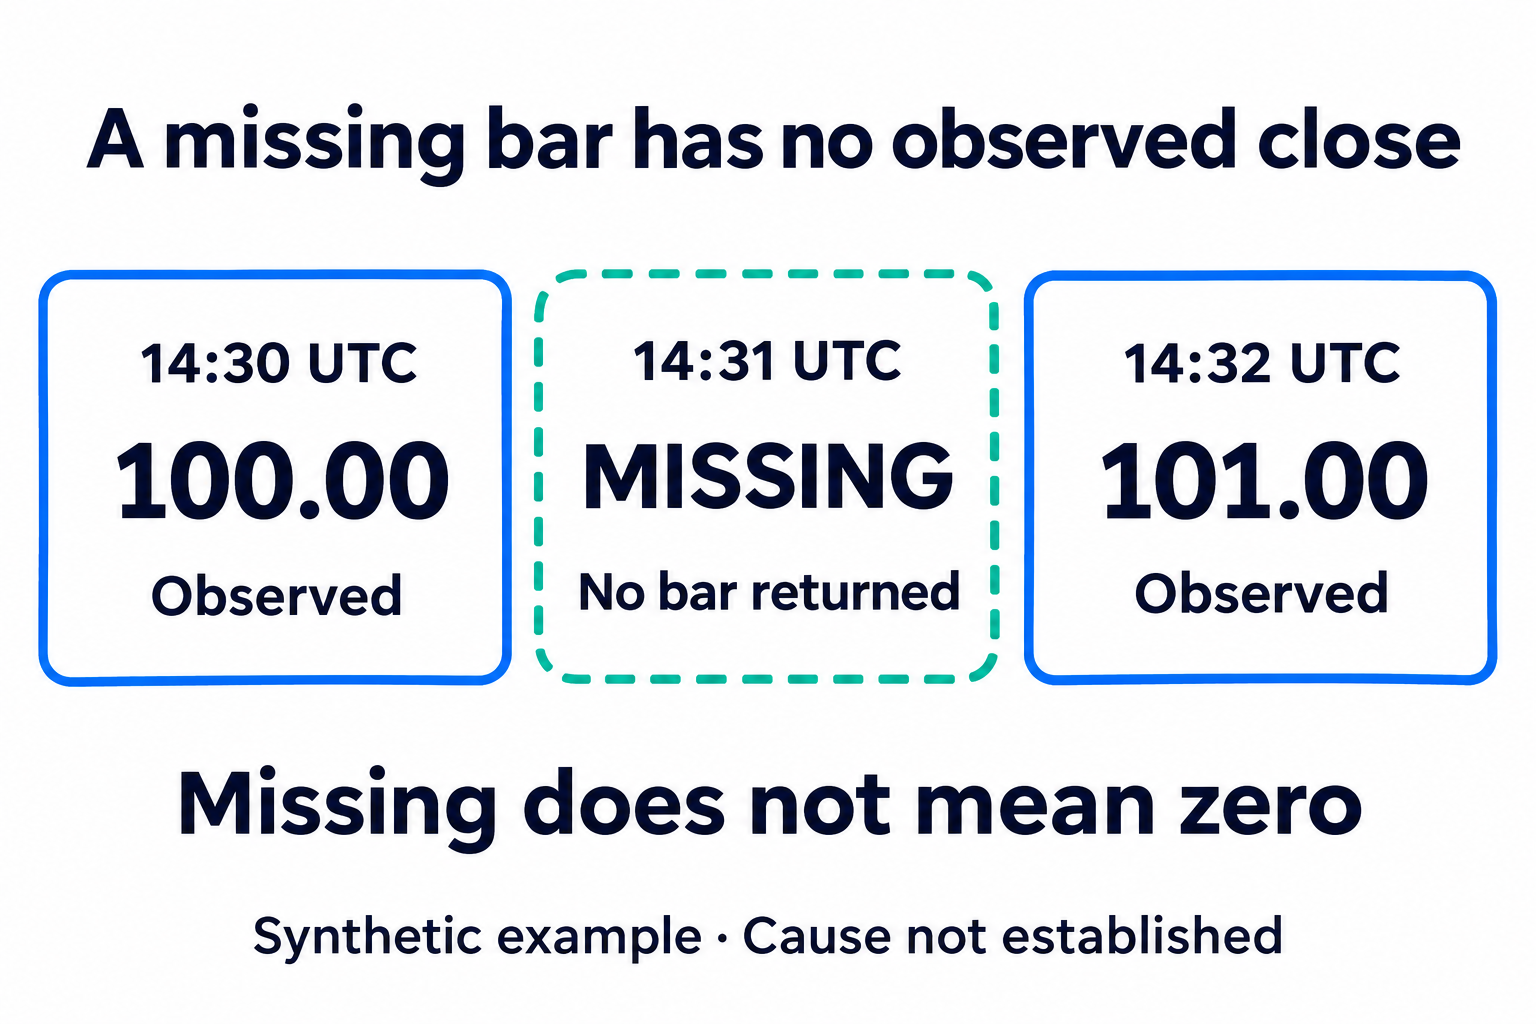
Figure 2. Synthetic close-price example in UTC. The middle slot has no returned observation. Its cause is unknown from these records alone; it must not become an invented zero-price candle.
A small adapter that preserves the missing slot
The following Python example runs offline with synthetic data. It accepts an already selected, increasing UTC time grid and normalized close records for one instrument. It preserves missing slots, accepts identical duplicate records, and rejects conflicting duplicates instead of silently choosing a value.
from decimal import Decimal

def align_closes(slots, rows):
    if slots != sorted(set(slots)):
        raise ValueError("Slots must be unique and increasing")
    allowed = set(slots)
    observed = {}
    for row in rows:
        time = row["time"]
        if time not in allowed:
            raise ValueError("Bar outside the selected grid")
        close = Decimal(str(row["close"]))
        if not close.is_finite() or close <= 0:
            raise ValueError("Expected a positive finite stock close")
        if time in observed and observed[time] != close:
            raise ValueError("Conflicting close for the same slot")
        observed[time] = close
    return [(time, observed.get(time)) for time in slots]

slots = ["14:30", "14:31", "14:32"]  # Synthetic UTC grid
rows = [
    {"time": "14:30", "close": "100.00"},
    {"time": "14:32", "close": "101.00"},
]
for time, close in align_closes(slots, rows):
    print(time, "MISSING" if close is None else close)
The output is 14:30 100.00, 14:31 MISSING, and 14:32 101.00 on separate lines. The function has preserved what the input says without claiming why the middle slot is absent.
This is a close-series example, not a downloader or exchange calendar. Production adapters should use full normalized timestamps rather than time-of-day strings, partition records by instrument and series settings, and validate the complete OHLCV record. A conflicting revision may be legitimate, but resolving it requires a documented revision policy. Raising an error here makes that decision visible.
Open source helps with implementation but cannot restore absent history
Open-source clients and data-processing tools can help build a stock API application. The distinction is between the software you can inspect or run and the underlying market-data service. An open-source client does not establish the upstream feed's coverage, usage rights, or historical depth.
For this charting task, inspect what the client does with pagination and missing values. A convenient wrapper may return a clean table while hiding a truncated query or a fill operation. Trace those transformations before using the result for research.
The same separation applies when using TickDB: the chart layer should retain the requested series settings and retrieval status alongside the returned candles. TickDB also documents that the final candle may still be forming. Mark that record as provisional when applicable; a changing current bar and an absent historical bar require different display behavior.
Verify the window before calling the chart complete
An acceptance check should cover more than whether the chart renders. Confirm that retrieval reached the endpoint's documented stopping condition, that the result is partitioned by the intended instrument and settings, and that unexplained gaps remain visible. Exercise an unfinished download, a missing slot, an identical duplicate, and a conflicting duplicate. Each should produce a deliberate result.
Do not turn the ratio of returned bars to clock minutes into a completeness score without establishing the expected-bar policy. A sparse instrument can legitimately have fewer bars under a trade-based aggregation rule. Conversely, a full-looking grid can conceal invented values.
The useful promise of a historical chart is that its displayed observations and limitations can be explained. A stock API supplies the records. The application must preserve the difference between a value that was observed, a value it derived, and a value it does not know.
Source basis: Alpaca Historical bars, Databento Aggregate bars, and TickDB Candlestick Data documentation, checked November 4, 2026. Code and numerical examples are synthetic.