The Complete Stock API Guide: 44 Global and China-Market Options
TickDB Research ·
Summary: Bloomberg, LSEG, FactSet, Massive, Alpha Vantage, Databento, Wind, Tushare, and AKShare address very different data needs. This guide organizes 44 providers, platforms, and tools into ten categories, then maps them to investment research, backtesting, alerts, financial apps, AI workflows, and trading integrations. Use it to build a shortlist, understand access requirements, and test a realistic sample. It includes a complete Python example, downloadable-data workflows, and reusable requirements and acceptance checklists.
1. The stock data landscape at a glance
| Category | Providers, platforms, and tools | Main role | Start here for |
|---|---|---|---|
| Institutional and reference data | Bloomberg, LSEG, FactSet, S&P Global Market Intelligence, Morningstar Direct Web Services, SIX Financial Information | Professional financial content, reference data, and enterprise delivery | Investment teams, valuation, portfolios, and internal data systems |
| Developer-focused financial APIs | Alpha Vantage, Finnhub, Twelve Data, EODHD, FMP / Financial Modeling Prep, Marketstack, TickDB | Request-based financial data and related streaming or AI interfaces | Research tools, dashboards, monitoring, and AI applications |
| US equity APIs and company data | Massive / formerly Polygon.io, Tiingo, Intrinio | US-focused prices, market events, and company content | US equity research and application development |
| Specialist datasets and market-data distribution | ICE Data Services, dxFeed, Barchart OnDemand, Nasdaq Data Link, QUODD / Xignite-related products, Databento | Historical datasets, event data, feeds, and distribution products | Event research, professional systems, and continuous delivery |
| Brokerage, terminal, and regional interfaces | Interactive Brokers / IBKR, Alpaca, Futu / Moomoo API, LongPort OpenAPI, QMT / XtQuant, Fugle | Account-linked interfaces, local environments, and regional market data | Trading integrations, terminal workflows, and Taiwan-equity data |
| Open-source data tools | AKShare, Yahoo Finance / yfinance | Python retrieval and data-preparation tools | Learning, individual research, and prototypes |
| China-focused research APIs | Tushare Pro, BaoStock | Queryable research data for tables and scripts | China A-share history and recurring research |
| China-focused quantitative data and environments | JQData / JoinQuant, RQData / Ricequant, GM Quant / GM SDK | Data packages and strategy-development environments | Factor research, backtesting inputs, and strategy workflows |
| China-focused institutional research services | Wind, iFinD / Tonghuashun, Choice / East Money, Hundsun Juyuan, Datayes | Terminals, databases, and institutional content | Research teams, reporting, and internal systems |
| Academic databases and research platforms | CSMAR, RESSET, CRSP US Stock Databases, WRDS / Wharton Research Data Services | Specialized research databases, historical samples, and access platforms | Academic studies and reproducible empirical research |
The categories describe each option's main role, rather than every capability it offers. WRDS is a research-access platform; AKShare and yfinance are software tools. Their access conditions and responsibilities differ from those of a licensed data feed.
Use the next section to find your use case, then open the relevant entries. If you already have a shortlist, go straight to the three-step selection process, working integration example, or requirements and acceptance templates.
2. Start with the job you need to get done
| Your project | Where to start | The first question to settle |
|---|---|---|
| Personal research and spreadsheets | Open-source tools, research APIs, or an existing terminal | Do the securities, fields, dates, and adjustments match your analysis? |
| Factor research and backtesting | Quantitative datasets, academic databases, and institutional content | Can you reconstruct the universe and information available on each historical date? |
| Intraday monitoring and alerts | Developer APIs, US equity services, and specialist feeds | Can your trigger tolerate events occurring between snapshots? |
| Market-data apps and stock pages | APIs or feeds matching the target markets and content | Do the data fields and customer-display arrangements fit the product? |
| AI research assistants | A suitable dataset, then an MCP connection or application integration | Can a reader trace the answer to a security, period, and original response? |
| Trading and brokerage integration | The relevant broker or terminal ecosystem | Are market-data and order-entry permissions both available? |
| Tick data and order-book research | Specialist datasets with the required event types | Which trades, quotes, order events, venues, and historical periods are included? |
| Institutional valuation and data procurement | Institutional, reference-data, and distribution products | Are price definitions, corporate actions, identifiers, and delivery suitable? |
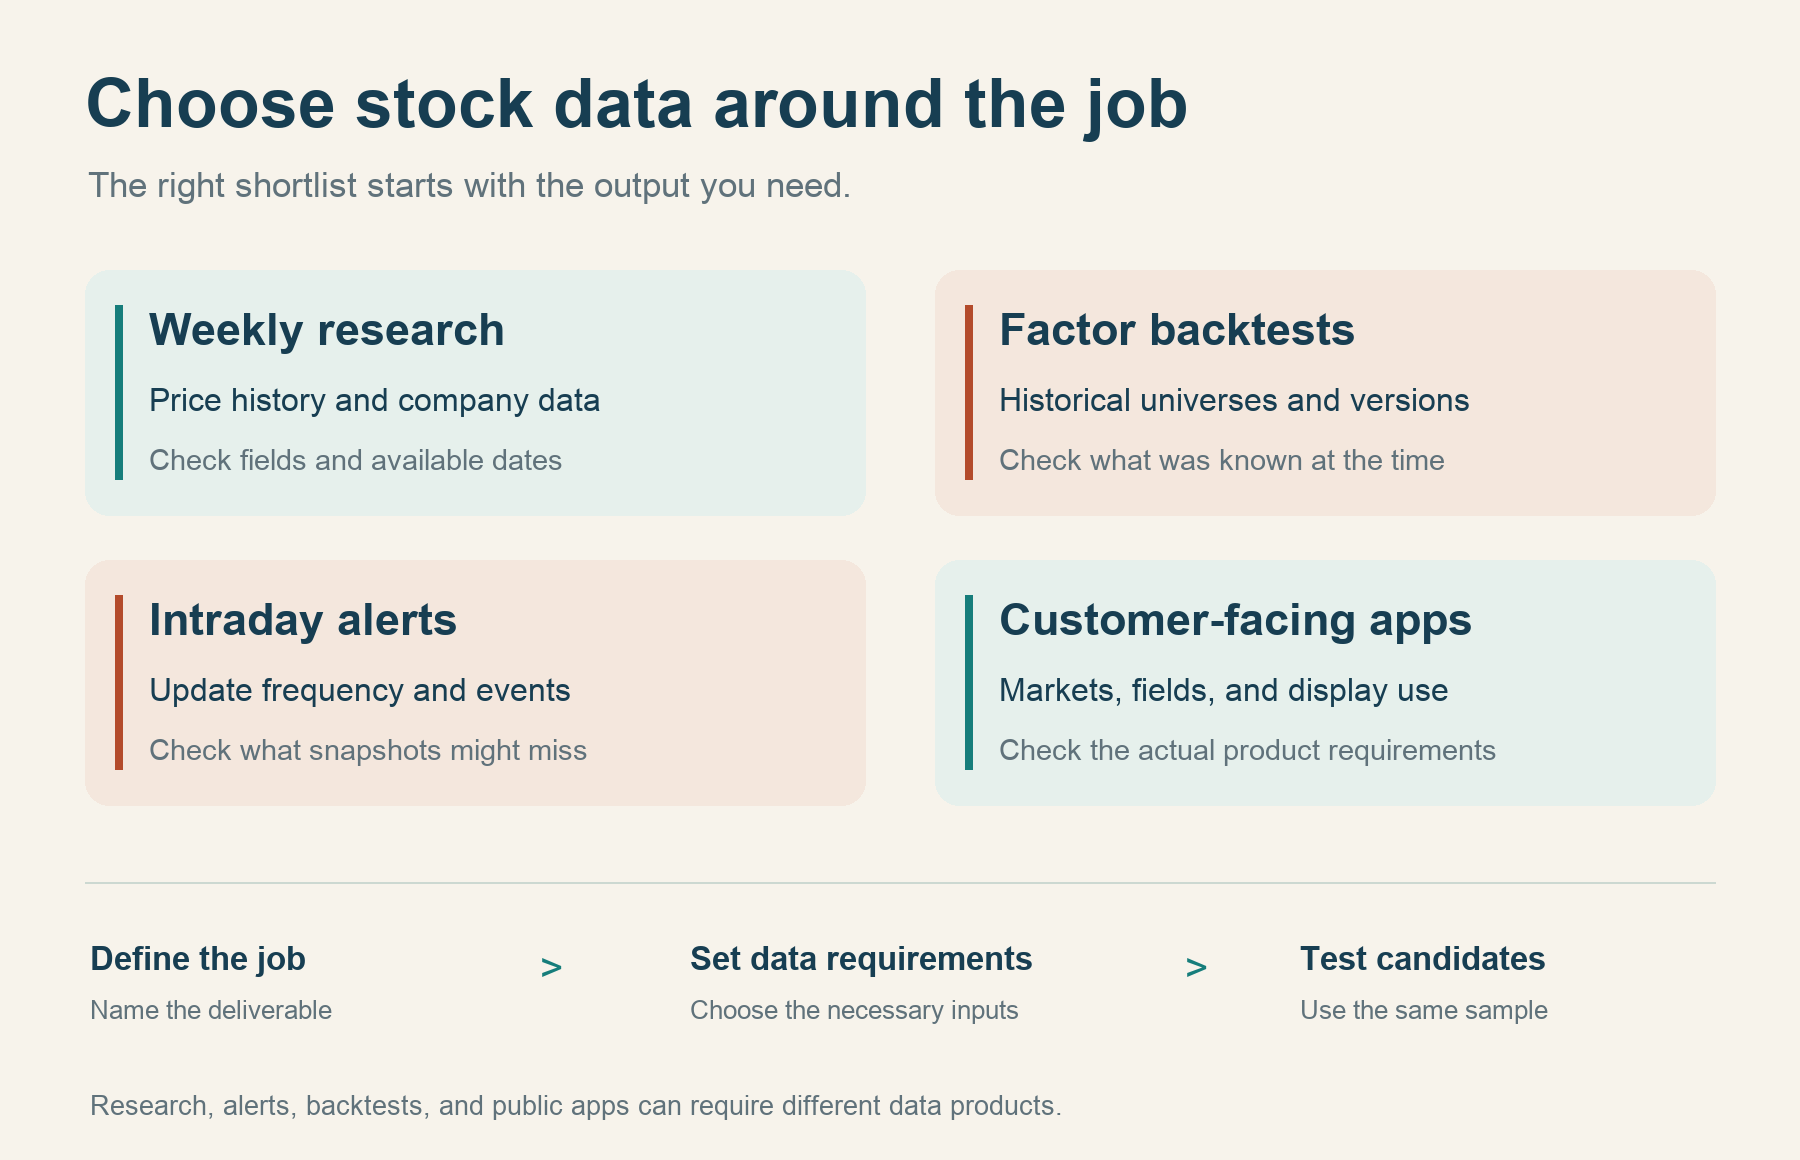
Personal research and recurring spreadsheets
Start with a reproducible table. For a weekly review of 20 stocks, list the securities, historical prices, financial fields, and update schedule. Every value should retain its security, reporting period or market date, unit, and retrieval time.
Check completeness before increasing frequency. A price series supplies an input to company analysis; financial-statement research also needs the appropriate company data.
Start with open-source tools or the developer API directory. For China A-shares, also see research APIs. An existing institutional terminal may already cover the task.
Factor research and backtesting
Write the data requirement in four parts: the historical security universe, prices and adjustments, financial-information timing, and the trading calendar. For US equity research, CRSP, Compustat, and the databases available through WRDS are relevant places to investigate. For China A-shares, examine the specific datasets offered by JQData, RQData, Tushare, and institutional databases.
Ask for a historical sample that exposes the difficult cases: delistings, identifier changes, and financial-statement revisions. A downloadable bar history answers only part of that requirement.
See academic databases, China-focused quantitative environments, and institutional content.
Intraday monitoring and price alerts
A dashboard that refreshes every minute may work with periodic snapshots. An alert that must detect a price touched at any point between those refreshes needs an appropriate event stream or interval data.
Record market timestamps and local receipt times. Define what the application should do during a closed session, a disconnect, and recovery. A successful price query is the beginning of a monitoring workflow; continuous operation requires its own handling.
See developer APIs, US-focused services, and specialist feeds.
Market-data apps and stock detail pages
List what the page will display: security identity, currency, price field, historical bars, market status, and update time. A page combining US, Hong Kong, and mainland Chinese equities must interpret dates and sessions separately for each market.
Your application also needs caching, loading and error states, user access controls, and a way to indicate stale data. Confirm the intended customer-display use when selecting the data product.
Start with developer APIs, US equity services, or specialist distribution. Add institutional content when the product requires broader company or reference data.
AI research and natural-language data queries
Turn “compare these companies” into a list of securities, periods, and metrics before asking a model to explain the results. MCP, the Model Context Protocol, is one way for a compatible AI client to call data tools. An application can also expose REST-based queries to a model.
Keep the original responses and dates available alongside the answer. Tool access supports factual retrieval; research judgments still need their own reasoning and checks.
Select the data content first. Then inspect the available AI or application integration. The worked example shows MCP queries and a separate Python export using the same data service.
Programmatic trading and brokerage connections
Separate the market-data workflow from account access, order submission, execution reports, and risk controls. IBKR, Alpaca, Futu, LongPort, and QMT each belong to a particular market and account ecosystem.
Validate read-only market data and paper-trading behavior independently. Fugle appears in the same broad directory category as a regional market-data service; that grouping does not assign it the trading capabilities of the broker entries.
See brokerage, terminal, and regional interfaces.
Tick data, spreads, and order-book research
Specify whether you need trades, quote updates, or order additions and cancellations. Then check venue coverage, timestamp precision, identifiers, and the available historical interval.
A one-minute OHLCV bar compresses a period into a few values. It cannot reconstruct every event within that period. Similarly, an endpoint returning recent trades is a different deliverable from years of historical event data.
See specialist datasets and feeds.
Valuation, reporting, and institutional procurement
Define the business date, price convention, currency, corporate actions, and company/security identifiers before choosing a delivery method. Relevant products may come from Bloomberg, LSEG, FactSet, S&P Global, Morningstar, SIX, Wind, Juyuan, or other institutional services in this directory.
Use the trial sample to validate joins and updates as well as individual prices. A security master and a latest-price endpoint solve different parts of the system.
See institutional and reference data, China-focused institutional services, and specialist delivery.
3. The directory: 44 providers, platforms, and tools
Each entry covers the same five questions: what it provides, why it may enter your shortlist, who it serves, how to get started, and what to confirm before committing. Choose the relevant category rather than reading every entry in order.
Institutional and reference data
Professional financial content, reference data, and enterprise delivery.
1. Bloomberg
What it provides: Bloomberg Terminal and BLPAPI-related access, including distinct desktop, server, and B-PIPE products.
Why consider it: Connects market data, reference information, and analytical workflows used in professional research and market-data systems.
Who it serves: Financial institutions, professional researchers, trading teams, and enterprise data teams.
Getting started: Choose the desktop or enterprise product, confirm entitlements and deployment requirements, install the matching BLPAPI components, establish a session, and request or subscribe to data.
Check before committing: Installing an SDK does not purchase data rights. Desktop API, Server API, and B-PIPE have different access arrangements; confirm server and client-display use for the selected product.
2. LSEG
What it provides: LSEG Data Platform and Data Library access through desktop, deployed streaming, and cloud-related channels, including products associated with the Refinitiv data ecosystem.
Why consider it: The library supports different session types, allowing institutional content to be integrated with existing research and application environments.
Who it serves: Professional researchers, institutional developers, and teams using LSEG or earlier Refinitiv products.
Getting started: Identify the content and appropriate desktop or platform session, configure authentication, install the LSEG Data Library, and start with price or reference fields before expanding the workflow.
Check before committing: Read older Eikon and Refinitiv documentation in the context of the specific current product. Similar code across access channels does not imply identical licensing or data entitlements.
3. FactSet
What it provides: APIs for prices and other financial content, with Enterprise SDKs for .NET, Java, Python, and TypeScript/JavaScript.
Why consider it: Security identifiers can connect price, company, and other datasets within institutional analytical and product systems.
Who it serves: Institutional analytics, portfolio, risk, and financial application teams.
Getting started: Subscribe to the required content and API, generate the appropriate credentials, install an SDK if useful, and query by security, date, and field.
Check before committing: Separate open-source SDK availability from data subscriptions. Confirm content sets, identifiers, batch behavior, and entitlements for each API; a price API does not include the entire FactSet catalog.
4. S&P Global Market Intelligence
What it provides: Research content such as Capital IQ and Compustat, with API, cloud, and file-delivery products covering financials, reference data, valuation, and related information.
Why consider it: Connects company and security data, historical financials, and research datasets to institutional models.
Who it serves: Fundamental researchers, investment banks, quants, and enterprise data teams.
Getting started: Select the dataset and delivery product, obtain authentication and entitlements, choose company or security identifiers, and inspect a sample against the data dictionary.
Check before committing: Distinguish company-level from security-level identifiers, reported from standardized financials, and restated values from versions available at a historical point in time. A financial-statement dataset is not a real-time trade feed.
5. Morningstar Direct Web Services
What it provides: Web services for investment data, research, and portfolio analysis, with equity-related content determined by the licensed product.
Why consider it: Can embed company information, investment research, and portfolio functions in wealth-management and analytical products.
Who it serves: Wealth managers, investment researchers, portfolio analysts, and financial product teams.
Getting started: Choose the current Web Services product, obtain authentication and content rights, confirm investment identifiers and accessible content, and query the required details or analysis.
Check before committing: Avoid relying on retired Equity Data API tutorials. Confirm content and identifiers separately for Direct Web Services, terminal products, and other Morningstar datasets.
6. SIX Financial Information
What it provides: Reference data, prices, corporate actions, funds, and other financial information delivered through APIs, data feeds, and files.
Why consider it: Can connect security master data with prices and corporate actions for banking, valuation, risk, and internal data operations.
Who it serves: Banks, asset managers, data operations, valuation teams, and risk-system developers.
Getting started: Specify securities and content, choose Web API, batch, or feed delivery, complete authentication and authorization, and validate field mappings and incremental updates.
Check before committing: Distinguish financial-information products from a particular exchange's own feed. Confirm identifiers, updates, corporate-action handling, and display scope for the actual delivery product.
Back to the directory · Find your use case
Developer-focused financial APIs
Request-based financial data and related streaming or AI interfaces.
7. Alpha Vantage
What it provides: HTTP interfaces for stock prices, technical indicators, fundamentals, and other financial data, with an official MCP entry point.
Why consider it: A straightforward starting pattern for research and prototypes built one function, symbol, and date range at a time.
Who it serves: Learners, lower-frequency researchers, financial-analysis prototypes, and AI data-query projects.
Getting started: Obtain a key, select the documented function, provide symbol and date parameters, inspect the response and quota conditions, and save the results.
Check before committing: Check free request allowances separately from premium data access. Real-time, delayed, intraday, and adjusted datasets may have different requirements; calculate whether the applicable allowance fits your workload.
8. Finnhub
What it provides: APIs for stock prices, company financials, news, estimates, and other content, with an official Python SDK.
Why consider it: Can combine price, company, and event information in financial application prototypes.
Who it serves: Developers, investment researchers, and fintech product teams.
Getting started: Obtain an API key, use the official SDK or HTTP, start with a quote or company-profile request, and then check access to the required history and event datasets.
Check before committing: A function in the SDK is not evidence that your account can access it. Confirm market coverage, timeliness, history, free-tier scope, and intended use for each endpoint.
9. Twelve Data
What it provides: Interfaces for equity and other asset prices, time series, reference data, fundamentals, and indicators, with streaming access documented separately.
Why consider it: Relevant to applications combining markets, instruments, and update intervals within one data workflow.
Who it serves: Developers of charts, price tools, monitoring systems, and multi-asset applications.
Getting started: Obtain a key, identify the correct security and exchange, request a time series or quote, and configure the relevant subscription if continuous updates are needed.
Check before committing: Verify request metering, batch behavior, WebSocket subscriptions, and market rights separately. The same ticker text can identify different securities on different exchanges.
10. EODHD
What it provides: APIs for end-of-day and intraday prices, fundamentals, corporate actions, and news, with WebSocket delivery for some real-time products.
Why consider it: Combines historical market data with company information and events for research and applications.
Who it serves: Historical researchers, screening-tool builders, fundamental analysts, and cross-market product teams.
Getting started: Register for a token, choose the data product and symbols, retrieve a historical or fundamental sample, and then expand into real-time or batch work as required.
Check before committing: Distinguish personal and commercial plans and global end-of-day content from specific real-time products. History, coverage, and timeliness must be checked for each product.
11. FMP / Financial Modeling Prep
What it provides: APIs for company profiles, financial statements, estimates, market prices, and history, alongside MCP and spreadsheet-related access.
Why consider it: Organizes prices and financials around company analysis, making it relevant to research dashboards and fundamental tools.
Who it serves: Fundamental researchers and developers of valuation tools, financial dashboards, and financial applications.
Getting started: Obtain a key, select the current documented API version, identify companies and securities, and query prices or statements while preserving dates and raw responses.
Check before committing: Check legacy versus current paths, personal versus commercial use, standardized financials, and revisions. Confirm price timeliness for the specific data product.
12. Marketstack
What it provides: REST and JSON access to end-of-day, intraday, historical, and related security data.
Why consider it: A candidate for lightweight applications needing request-based prices, history, and security lookup.
Who it serves: Developers of simple charts, reports, website components, and learning prototypes.
Getting started: Register for a key, choose endpoints from the current API version, query symbols and dates, and inspect pagination, free-plan scope, and timeliness.
Check before committing: Global end-of-day coverage and US intraday coverage are different offerings. Confirm real-time requirements, historical depth, and commercial use for the actual product and account.
13. TickDB
What it provides: A stock market data service for China A-shares, Hong Kong, and US equities, with snapshots, adjusted historical bars, order-book data, recent trades, and REST, WebSocket, and MCP access.
Why consider it: One service can supply cross-market watchlists, research tables, and stock pages, with structured responses available to AI tools. Company profiles and the financial, valuation, and corporate-action interfaces listed in the official catalog can be evaluated for additional research needs.
Who it serves: Financial product, application-development, quantitative-research, and AI-workflow teams integrating equities from these three markets.
Getting started: Check symbols and entitlements, retrieve quotes and history, and save the original responses. Choose streaming or AI-tool access as needed; Section 5 includes a complete CSV-export script.
Check before committing: The recorded example retrieved three-market quotes, Cambricon daily bars, a company profile, recent trades, and order-book data. Streaming is described from documentation rather than a long-running test. Recent trades are not a complete historical trade-and-quote archive, and data access does not supply order execution or a complete point-in-time backtest dataset.
Back to the directory · Find your use case
US equity APIs and company data
US-focused prices, market events, and company content.
14. Massive / formerly Polygon.io
What it provides: US-focused quotes, trades, historical prices, and reference data through REST, WebSocket, and file delivery.
Why consider it: A focused route from US equity charts to more detailed market events and bulk history.
Who it serves: US equity researchers and developers of trading tools and data applications, including projects requiring historical batches.
Getting started: Obtain a key, select the stock-data product and permissions, start with security reference data and bars, and add quotes, trades, or files as needed.
Check before committing: Check end-of-day access, real-time data, historical tick data, and customer-facing usage separately. A free-key result does not establish the depth of every product. Polygon.io and Massive are treated as one entry here.
15. Tiingo
What it provides: REST and WebSocket data services with separate documented routes for end-of-day prices, news, fundamentals, IEX, overnight data, and other content.
Why consider it: Supports research and intraday observation built around an explicitly chosen source and trading session.
Who it serves: US equity researchers and developers combining portfolio tools, news, and prices.
Getting started: Register for a token, choose the required end-of-day or intraday data route, retrieve a small sample, and check fields, sessions, and entitlements.
Check before committing: Review source and usage conditions for IEX, overnight, and other market-data products independently. Check free accounts, higher-volume usage, and commercial use against the chosen product.
16. Intrinio
What it provides: Prices, financials, reference data, and related APIs organized by data product, with SDKs and streaming access for real-time equity prices.
Why consider it: Allows teams to select specific content subscriptions and incorporate them into applications over time.
Who it serves: Fintech, research, fundamental-analysis, and customer-facing data application teams.
Getting started: Choose the data product, obtain a key, configure an SDK or HTTP client, query companies, securities, and fields, and inspect pagination, limits, and usage rights.
Check before committing: An API account and a content subscription are separate concerns. Access to one product does not imply that every real-time or financial dataset is enabled.
Back to the directory · Find your use case
Specialist datasets and market-data distribution
Historical datasets, event data, feeds, and distribution products.
17. ICE Data Services
What it provides: Market and reference data, consolidated feeds, historical data, and multiple delivery options.
Why consider it: Relevant when a project grows from ad hoc queries into continuous institutional data delivery, historical storage, and business-system integration.
Who it serves: Institutional trading, risk, valuation, and market-data distribution teams.
Getting started: Specify the product, markets, and delivery method, confirm content and use, configure the connection, and validate the target real-time or historical workload.
Check before committing: Consolidated feeds, historical archives, evaluated prices, and APIs are separate products. Specify the exchanges, event types, and deployment environment in the requirement.
18. dxFeed
What it provides: Real-time and historical market data from exchanges and other sources, with multiple asset classes and API interfaces.
Why consider it: A candidate for continuous event streams and distribution supporting quotes, market depth, and professional data applications.
Who it serves: Brokers, trading platforms, financial websites, and professional trading and technology teams.
Getting started: Choose exchanges and event types, confirm subscriptions and distribution conditions, obtain credentials, and validate subscriptions, history, and recovery behavior.
Check before committing: Quotes, trades, order events, and depth are different data objects. Confirm the source, venues, event format, and intended use of the specific feed.
19. Barchart OnDemand
What it provides: Web services for quotes, history, reference data, and related content. Functions such as getQuote and getHistory serve different tasks.
Why consider it: Useful for request-based workflows with defined symbols and historical intervals.
Who it serves: Financial websites, researchers, quote-display applications, and teams working across asset classes.
Getting started: Confirm the OnDemand product and key, select quote or historical access, specify symbols, intervals, and dates, and validate sessions and row counts.
Check before committing: Website membership and API subscriptions are separate. Check daily, minute, and tick data definitions, continuous-futures treatment where relevant, and volume aggregation rules.
20. Nasdaq Data Link
What it provides: A dataset platform and API-delivery ecosystem associated with the former Quandl platform, including tabular data, Python tools, and specific real-time, delayed, and historical products.
Why consider it: Lets teams select and query particular datasets while managing research tables and market-data delivery as separate requirements.
Who it serves: Researchers, quants, fintech teams, and institutions seeking named datasets.
Getting started: Create an account and key, subscribe to the target dataset or market-data product, use its Tables, REST, streaming, or SDK interface, and check the returned coverage.
Check before committing: An account does not unlock every dataset. Verify that older Quandl tutorials and datasets are still applicable. Table queries and real-time feeds can use different interfaces and entitlements.
21. QUODD / Xignite-related products
What it provides: Cloud financial data APIs, feeds, and market-data products. The Xignite entry point now routes to QUODD.
Why consider it: Relevant to products assembling price, reference, and corporate-action content as purchased data components.
Who it serves: Wealth-management, financial-media, fintech, and client-application teams.
Getting started: Select content from the catalog, define internal or display use, confirm authentication and delivery, and implement a sample using that product's documentation.
Check before committing: Check current product names and how legacy Xignite services map to the current offering. Do not carry forward old blog claims about free access or endpoint terms.
22. Databento
What it provides: Real-time and historical market data with documented event formats, bars, batch retrieval, and instrument-identification tools.
Why consider it: A candidate for research requiring exchange events, market depth, and historical replay rather than only a latest-price field.
Who it serves: Market-microstructure researchers, professional quants, execution researchers, and developers consuming detailed market events.
Getting started: Obtain a key and dataset access, choose the source and event format, request a historical interval or subscribe to live data, and validate identifiers, event ordering, and transformations.
Check before committing: Confirm datasets, venues, trade versus order events, historical replay, and live entitlements separately. Event-level data is an input to an execution model, not a finished executable backtest.
Back to the directory · Find your use case
Brokerage, terminal, and regional interfaces
Account-linked interfaces, local environments, and regional market data.
23. Interactive Brokers / IBKR
What it provides: TWS API, Web API, and related interfaces connecting market data, accounts, and trading workflows.
Why consider it: Relevant when data access needs to connect with an existing brokerage-account workflow.
Who it serves: Programmatic traders, self-directed account holders, and institutional integration teams.
Getting started: Confirm account and API eligibility, choose the TWS/Gateway or Web route, configure authentication and market-data subscriptions, and validate read-only quotes and a paper environment first.
Check before committing: Handle data, trading, paper, and live entitlements separately. Check market-data charges, pacing, professional-user classification, and redistribution conditions before deployment. The example in this guide places no orders.
24. Alpaca
What it provides: Market Data APIs alongside Trading and Broker API products, with HTTP, WebSocket, and SDK market-data access.
Why consider it: Supports workflows around US equity data and trading applications, with distinct models for individual trading and brokerage partners.
Who it serves: US equity developers, individual tool builders, and fintech teams eligible for the relevant access model.
Getting started: Choose the Trading or Broker integration model, obtain the corresponding credentials, select the market-data source, run read-only queries, and then validate paper workflows separately.
Check before committing: Check single-source data such as IEX versus consolidated coverage, data versus trading permissions, account-region eligibility, and customer-product requirements.
25. Futu / Moomoo API
What it provides: Market-data and trading functionality accessed through the OpenD gateway and language SDKs.
Why consider it: Relevant to users already in the brokerage ecosystem who want programmatic access to supported markets and account workflows.
Who it serves: Individual developers, brokerage clients, and trading-tool builders.
Getting started: Install and run OpenD, sign in with the relevant platform account, install the SDK, and connect to the gateway after checking market-data entitlements.
Check before committing: Prices visible in the app may have different API access conditions. Confirm account requirements, subscriptions, historical quotas, and trading permissions separately.
26. LongPort OpenAPI
What it provides: APIs and SDKs for quotes, subscriptions, historical bars, calendars, and trading, with AI-tool entry points also documented.
Why consider it: Relevant to market-data and account applications for supported markets such as Hong Kong and the US.
Who it serves: Individual developers, existing platform users, and financial application teams.
Getting started: Create the applicable application and credentials, configure SDK authentication, validate quotes or history, and add subscriptions as needed. Follow the separate account workflow for trading.
Check before committing: Confirm data and trading access, symbol conventions, market coverage, and customer use separately. Do not assume one account's subscription can be redistributed to other users.
27. QMT / XtQuant
What it provides: The XtData market-data module and related trading-connection tools, commonly used with a corresponding terminal or data-service environment.
Why consider it: Relevant to strategy programs reading historical and current data within an existing brokerage or research deployment.
Who it serves: China A-share developers and individuals or teams using QMT or MiniQMT environments.
Getting started: Obtain the required terminal or data-service access, install the matching XtQuant components, establish the connection, and subscribe to or download data before reading the local store.
Check before committing: Broker versions, research services, terminal dependencies, and data rights can differ. Reading a cache and completing the necessary historical download are separate steps; confirm trading-module access independently.
28. Fugle
What it provides: Taiwan equity market data through REST, WebSocket, and SDK interfaces, including trades, minute bars, order-book information, and related channels.
Why consider it: A market-specific option for evaluating Taiwan-equity data objects, sessions, and update behavior.
Who it serves: Developers of Taiwan stock-monitoring tools and related market-data applications.
Getting started: Register for a market-data key, choose REST or WebSocket, authenticate, and subscribe to the required symbols and channels while verifying actual message arrival.
Check before committing: A successful connection or subscription acknowledgment does not guarantee that data has arrived. Check premarket, closing, odd-lot, channel-limit, and plan conditions. This entry covers market data; trading access is a separate question.
Back to the directory · Find your use case
Open-source data tools
Python retrieval and data-preparation tools.
29. AKShare
What it provides: An open-source Python library with functions for market prices, financial statements, shareholders, dividends, fund flows, and other financial data.
Why consider it: A broad set of entry points for finding and organizing research inputs. It works best when you are prepared to manage individual functions and their upstream sources.
Who it serves: Python learners, individual researchers, data preparation projects, and small research prototypes.
Getting started: Install the library and record its version. Find the relevant function, inspect its source, parameters, and fields, then retrieve a small sample before scaling up.
Check before committing: Treat it as software, not a commercial data package with identical terms across every function. Review the software license and upstream data terms separately, and plan for maintenance of the functions you use.
30. Yahoo Finance / yfinance
What it provides: yfinance is an open-source Python tool for accessing Yahoo Finance-related data. It is not Yahoo's official SDK.
Why consider it: A convenient starting point for price analysis and related research, provided you check the upstream conditions and the returned data.
Who it serves: Individual research, Python education, and small analytical prototypes.
Getting started: Install and record the yfinance version. Select symbols and dates, retrieve a sample, and inspect time zones, adjustment settings, missing values, and upstream terms.
Check before committing: An open-source software license does not grant redistribution rights to the underlying data. Evaluate the actual data requirements and operating arrangements before using a research script in a customer-facing product.
Back to the directory · Find your use case
China-focused research APIs
Queryable research data for tables and scripts.
31. Tushare Pro
What it provides: A financial data service accessed through a Python SDK, HTTP, and related interfaces, with stock prices, security information, and a catalog of research datasets.
Why consider it: Its table-oriented catalog and access rules make it useful for building research datasets on a recurring schedule.
Who it serves: Individual quants, China A-share researchers, educational projects, and smaller research teams.
Getting started: Register for a token, install the SDK or use HTTP, check access to the target endpoint, and query the required securities, dates, and fields before saving the results.
Check before committing: Points act as access thresholds rather than a balance deducted on every call. Some interfaces, including certain minute-data and news products, have separate access requirements. Check adjustment rules, update schedules, and historical coverage for the dataset you need.
32. BaoStock
What it provides: A Python-accessible service for Chinese equity research data, with documented login, historical price-bar queries, and export workflows.
Why consider it: A practical place to start with historical prices and basic research without building a complex integration first.
Who it serves: Individual researchers, machine-learning courses, and China A-share historical analysis.
Getting started: Install baostock, log in, specify the symbol, fields, dates, and adjustment mode, read the results, and close the session.
Check before committing: Check the fields, update schedule, and available dates for each data category. Historical bar downloads alone do not establish support for streaming prices or the conditions required for a public application.
Back to the directory · Find your use case
China-focused quantitative data and environments
Data packages and strategy-development environments.
33. JQData / JoinQuant
What it provides: A financial data package for local quantitative research. Its official Python SDK provides authentication and access to stock, financial, and related data.
Why consider it: It can extend a platform-based research workflow into a local analysis environment, with prices and financial data organized around the research question.
Who it serves: China A-share quants, factor researchers, educators, and teams familiar with JoinQuant.
Getting started: Open the appropriate JQData account, install jqdatasdk, authenticate as required by the SDK, and query a small target dataset.
Check before committing: Confirm local JQData entitlements, quotas, and datasets separately from the hosted research environment. Read the endpoint definitions for symbols, price adjustments, and when financial information became public.
34. RQData / Ricequant
What it provides: A financial data API with documented categories including China A-shares, Hong Kong equities, futures, and funds, accessed through Python, HTTP, and CLI interfaces.
Why consider it: Its relationship with a broader research-tool ecosystem can help teams build systematic workflows around a defined data dictionary.
Who it serves: Quantitative researchers, strategy teams, and institutions processing data locally.
Getting started: Obtain an account and data entitlements, configure Python or HTTP authentication, query the target instruments and fields over a small interval, then build incremental updates.
Check before committing: The data API, backtesting framework, and optimizer are distinct products. Confirm financial point-in-time data, historical universes, intervals, and market access for the selected dataset.
35. GM Quant / GM SDK
What it provides: A quantitative development environment combining market-data queries, event subscriptions, backtesting, and trading-related interfaces.
Why consider it: It provides a path from data access to strategy events, simulation, and trading integration within the same environment.
Who it serves: Developers using Python or C++ for strategies, backtesting, and simulation.
Getting started: Obtain the relevant platform account and token, install the SDK and required runtime, authenticate, and start with a historical or current-price query before developing event subscriptions.
Check before committing: Platform versions, participating brokers, and data entitlements can differ. Verify data access, strategy execution, and trading-account permissions independently; simulated fills are not evidence of live execution quality.
Back to the directory · Find your use case
China-focused institutional research services
Terminals, databases, and institutional content.
36. Wind
What it provides: A financial terminal and Client API covering market prices, company financials, macroeconomic indicators, industry data, and other research content.
Why consider it: The terminal, indicator definitions, and programmatic access can support one research workflow, particularly for teams already using Wind.
Who it serves: Institutional researchers, quants, portfolio teams, and analysts connecting research spreadsheets to internal models.
Getting started: Confirm terminal and API entitlements, install the appropriate client and language components, sign in, and use the code generator or an example to request specified fields.
Check before committing: Separate desktop use from server deployment and internal database requirements. Confirm indicator definitions, real-time permissions, and export rights; a terminal seat does not automatically cover arbitrary backend distribution.
37. iFinD / Tonghuashun
What it provides: Data interfaces covering reference information, financials, historical high-frequency series, real-time prices, macroeconomic indicators, and specialized datasets, with multiple language interfaces.
Why consider it: Its query and command tools can turn terminal-based research into repeatable data retrieval for analysis, monitoring, and custom reports.
Who it serves: Investment researchers, financial product teams, and institutions combining prices and fundamentals.
Getting started: Obtain the required data access, choose the appropriate client or interface, configure authentication, and test one security and one field before expanding dates and universes.
Check before committing: Confirm terminal access, API access, data categories, and operating-system support separately. Screening results from specialized functions still require a research interpretation.
38. Choice / East Money
What it provides: Choice's quantitative interfaces provide cross-sectional data, time series, thematic reports, trading calendars, and related functions across supported language environments.
Why consider it: It can extend an existing Choice research process into automatically updated spreadsheets and extraction scripts.
Who it serves: Analysts, asset-management teams, and terminal users looking to automate recurring work.
Getting started: Confirm trial or production entitlements, install official components, log in and initialize the session, then use the command-generation tools to select securities, fields, and dates.
Check before committing: Check language components, operating-system compatibility, traffic limits, function entitlements, and export scope. Content visible in the terminal may have different API access conditions.
39. Hundsun Juyuan
What it provides: Financial reference databases, application and thematic databases, and related investment-research products for institutional systems.
Why consider it: Data can be organized around research, trading, valuation, accounting, risk, and performance workflows, making it relevant to long-term internal data infrastructure.
Who it serves: Securities firms, asset managers, banks, and teams integrating financial databases with business systems.
Getting started: Define the business and data requirements, select the database or delivery product, obtain a data dictionary and samples, and map security identifiers, fields, and updates.
Check before committing: Confirm database, thematic-product, MCP, and application-component entitlements separately. A broad product catalog does not mean every capability is included in one subscription.
40. Datayes
What it provides: Financial datasets, the UQER quantitative research environment, and related research products spanning conventional and alternative data.
Why consider it: Relevant to teams connecting financial content with research tools, factors, and investment workflows.
Who it serves: Institutional investment researchers, quants, and financial product teams.
Getting started: Start with the required data product or research platform, obtain the account and authorization, inspect the catalog and samples, and select the relevant API or agreed delivery method.
Check before committing: Distinguish the UQER research environment from separately delivered data products. Old tutorials may contain obsolete tokens, endpoints, or free-access conditions.
Back to the directory · Find your use case
Academic databases and research platforms
Specialized research databases, historical samples, and access platforms.
41. CSMAR
What it provides: Financial and economic research databases with web queries and documented delivery options such as Data Loader Feed or APIs, depending on the product.
Why consider it: Its research tables and subject-specific datasets can support studies linking prices, companies, and events with documented definitions.
Who it serves: Academic researchers, doctoral students, empirical-finance teams, and institutions needing specialized datasets.
Getting started: Confirm personal or institutional subscriptions, identify the required database, fields, and sample, choose an authorized export or delivery route, and validate table joins.
Check before committing: Institutional and database entitlements vary. Campus web access should not be treated as evidence of unrestricted API access or commercial usage rights.
42. RESSET
What it provides: Databases for financial research and modeling, alongside financial-text and related products. Database content and interfaces depend on the subscription.
Why consider it: Useful for projects that prioritize field definitions, sample construction, and reproducible research, especially where an institution already has database access.
Who it serves: Universities, financial research and teaching teams, and analysts working with structured research data.
Getting started: Confirm account entitlements, choose the database, fields, dates, and securities, retrieve a sample table, and separately confirm programmatic access if needed.
Check before committing: Database queries, text-product APIs, and live market feeds are different capabilities. A text API is not evidence of a general real-time stock API. Follow the selected product's usage and citation requirements.
43. CRSP US Stock Databases
What it provides: Historical US equity research databases containing daily and monthly prices, corporate actions, and both active and inactive securities.
Why consider it: Persistent identifiers such as PERMNO and PERMCO help researchers track securities and companies through ticker and name changes.
Who it serves: Academics, long-horizon US equity factor researchers, and quantitative teams concerned with historical-universe consistency.
Getting started: Obtain the appropriate research license, choose the delivery method and version, check security and company identifiers, and extract a historical sample with the required corporate-action treatment.
Check before committing: A historical research database serves a different purpose from an intraday feed. Verify delistings, return definitions, release versions, and usage conditions in the data dictionary, and keep company-level and security-level identifiers distinct.
44. WRDS / Wharton Research Data Services
What it provides: A research platform providing access to multiple databases through web tools, SQL, and supported Python workflows.
Why consider it: A queryable environment can reduce the work of repeatedly downloading and joining research files from different sources.
Who it serves: Universities, empirical-finance researchers, and data teams with institutional subscriptions.
Getting started: Confirm institutional and individual account access, inspect the libraries and tables available to you, connect through the web interface or Python, and test a small query before joining datasets.
Check before committing: WRDS is an access platform, not an additional independent stock-price source. An account does not necessarily include CRSP, Compustat, or every other library. Check identifier mappings and validity dates when joining tables.
Back to the directory · Find your use case
4. Build a shortlist in three steps
Step 1: Specify a deliverable
“I need stock data” leaves the important decisions open. A usable requirement describes an output, a schedule, and an audience:
After each trading day, generate completed daily bars and a financial-factor table for a defined security universe, for internal research.
Or:
During a specified trading session, update a particular quote field for 500 stocks on an internal dashboard.
A personal spreadsheet, an internal dashboard, and a public app can show similar numbers while requiring different datasets, permissions, and operating arrangements.
Step 2: Keep only options that meet the essential conditions
| Project | Required inputs | A useful validation sample |
|---|---|---|
| Recurring research table | Securities, historical prices, and selected financial fields | One security's price history and a corresponding financial record |
| Historical factor backtest | Historical universes, price definitions, and information available at the time | A historical slice including delisted or renamed securities and disclosure/revision records |
| Intraday alert | Data for the required market and session, including intermediate events if necessary | An observation log with market timestamps, receipt times, and recovery behavior |
| Customer-facing stock page | Quotes, bars, identity, and market state | Fields matching the page, plus confirmation of display use |
| Programmatic trading | Market-data inputs, account access, and order workflow | Read-only data checks and a separate paper-order test |
Only test conditions that matter to the task. Order-book depth need not be the first filter for a weekly research table. A financial backtest, however, needs more than a general promise of “fundamental data.” Consult the reference section when a definition changes the decision.
Step 3: Compare the same small workload
Give two or three candidates the same symbols, dates, fields, update frequency, and intended use. Record actual results, omissions, required transformations, and the applicable commercial arrangement.
After the essential conditions pass, compare integration work, recurring cost, and maintenance. A free endpoint can still leave substantial data preparation or operational work. The templates below make that comparison easier to repeat.
5. A working example: three-market quotes and research CSVs with TickDB
TickDB is a stock market data service for US equities, Hong Kong equities, and mainland China A-shares. Its interfaces provide snapshots and historical bars, with order-book data, recent trades, and company-related information available through the relevant endpoints and entitlements.
For a cross-market project, the practical benefit is one service connection for the watchlist, research table, or stock page. Keep each market's symbols, sessions, units, and price conventions explicit while using the same service to retrieve the inputs.
Where this example fits
| What you are building | Relevant data or interface | What your project receives |
|---|---|---|
| Cross-market watchlist or stock page | Snapshots, historical bars, order-book data, and recent trades | Inputs for prices, charts, and current market information |
| Research table or backtest preparation | Historical prices with supported adjustment modes | A series you can save and process; research logic remains in your program |
| Intraday dashboard | REST queries or documented WebSocket subscriptions | Request-based retrieval or continuous updates, depending on the chosen integration |
| AI data assistant | MCP tools and structured responses | Data that an AI client can query and retain with symbols and timestamps |
| Company-research context | Company profiles; financial, valuation, dividend, and corporate-action interfaces in the official catalog | Additional content to evaluate field by field for your research needs |
Use REST for fixed queries and exports, WebSocket when the application needs streaming updates, and MCP for compatible AI clients. The recorded work below used REST and MCP. WebSocket is described from the documented product interface; this example did not run a long-duration streaming test.
The TickDB stock data page is the starting point for checking market coverage and obtaining your own access credentials.
The example retrieves quotes for Cambricon, Tencent, and Apple, followed by five daily bars for Cambricon. It preserves raw JSON, exports CSVs, and records when the responses were received. These are recorded samples from November 5, 2026, not live prices at the time you read this guide.
Step 1: Confirm symbols and account access
Use the symbols 688256.SH, 700.HK, and AAPL.US for this example. The first is Cambricon, a mainland China A-share; the others are Tencent in Hong Kong and Apple in the US. Do not substitute another provider's ticker format without checking the security identity.
Confirm that your account has the required markets, securities, and historical access. The example account could query these symbols when the sample was collected; account entitlements can differ.
Step 2: Retrieve a sample through MCP
In a client that supports the relevant HTTP MCP connection, configure https://mcp.tickdb.ai/ and supply your key in the X-TickDB-Key authentication header. Configuration syntax depends on the client. The REST code below uses a different header, X-API-Key.
A useful client prompt is:
Retrieve stock quotes for 688256.SH, 700.HK, and AAPL.US. Show each symbol, latest price, and original market-data timestamp. Then retrieve the latest five daily bars for 688256.SH using the API's forward adjustment mode. Preserve tool responses, leave missing values missing, and do not turn the prices into an investment recommendation.
The recorded tool parameters were:
{"tool":"get_ticker","arguments":{"symbols":"688256.SH,700.HK,AAPL.US","type":"stock"}}
{"tool":"get_kline","arguments":{"symbol":"688256.SH","type":"stock","interval":"1d","limit":5,"adjust":"forward"}}
The November 5 MCP query returned:
| Security | Returned latest price | Market timestamp in milliseconds | Market time in UTC |
|---|---|---|---|
Cambricon 688256.SH | 850 | 1793848111000 | 2026-11-05 03:08:31 |
Tencent 700.HK | 427.4 | 1793848112000 | 2026-11-05 03:08:32 |
Apple AAPL.US | 349.51 | 1793826001000 | 2026-11-04 21:00:01 |
A company-profile query was also used to confirm Cambricon's security identity. The daily-bar response contained five records with closing fields of 880, 861, 767.93, 847.66, and 850. The last record was the current session's bar and could still change.
MCP supports task-based retrieval in an AI client. A completed tool call is a discrete query; continuous monitoring needs a separate subscription or polling workflow.
Step 3: Save the complete Python program
This program uses only the Python standard library and was run successfully with Python 3.12.12. Save it as tickdb_start.py.
It makes two GET requests: a batch quote request and a historical-bar request. It checks the response status and requested symbols, writes raw JSON and CSV files, and records local receipt times in UTC. It exits if the output directory already exists so that an earlier sample is preserved.
import argparse
import csv
import json
import os
import sys
from datetime import datetime, timezone
from pathlib import Path
from urllib.error import HTTPError, URLError
from urllib.parse import urlencode
from urllib.request import Request, urlopen

BASE = "https://api.tickdb.ai"


def iso_ms(value):
    if value is None:
        return ""
    return datetime.fromtimestamp(int(value) / 1000, timezone.utc).isoformat()


def fetch(path, params, key):
    request = Request(
        BASE + path + "?" + urlencode(params),
        headers={"X-API-Key": key, "Accept": "application/json",
                 "User-Agent": "TickDB-Article-Verification/1.0"},
    )
    try:
        with urlopen(request, timeout=20) as response:
            result = json.load(response)
    except HTTPError as exc:
        raise RuntimeError(f"HTTP {exc.code}: check key, permission and limits") from None
    except (URLError, TimeoutError, json.JSONDecodeError) as exc:
        raise RuntimeError(f"Network/JSON error: {type(exc).__name__}") from None
    if result.get("code") != 0:
        message = str(result.get("message", "API error")).replace(key, "[redacted]")
        raise RuntimeError(f"API {result.get('code')}: {message}")
    return result, datetime.now(timezone.utc).isoformat()


def main():
    parser = argparse.ArgumentParser()
    parser.add_argument("--symbols", default="688256.SH,700.HK,AAPL.US")
    parser.add_argument("--history-symbol", default="688256.SH")
    parser.add_argument("--out", default="tickdb_output")
    args = parser.parse_args()
    key = os.environ.get("TICKDB_API_KEY", "").strip()
    if not key:
        raise RuntimeError("Set TICKDB_API_KEY before running")
    out = Path(args.out)
    if out.exists():
        raise RuntimeError("Output folder already exists; choose a new --out")
    ticker, received = fetch("/v1/market/ticker", {
        "symbols": args.symbols, "type": "stock",
    }, key)
    history, history_received = fetch("/v1/market/kline", {
        "symbol": args.history_symbol, "type": "stock",
        "interval": "1d", "limit": 5, "adjust": "forward",
    }, key)
    quotes = ticker.get("data")
    bars = history.get("data", {}).get("klines")
    if not isinstance(quotes, list) or not quotes:
        raise RuntimeError("No quote records returned")
    if not isinstance(bars, list) or not bars:
        raise RuntimeError("No K-line records returned")
    returned = {q.get("symbol") for q in quotes}
    if not set(args.symbols.split(",")).issubset(returned):
        raise RuntimeError("Requested symbols are missing from the response")
    if history["data"].get("symbol") != args.history_symbol:
        raise RuntimeError("History symbol does not match the request")
    out.mkdir(parents=True)
    for name, body in [("ticker.raw.json", ticker), ("kline.raw.json", history)]:
        (out / name).write_text(json.dumps(body, ensure_ascii=False, indent=2), encoding="utf-8")
    fields = ["symbol", "last_price", "timestamp_ms", "data_time_utc", "received_time_utc"]
    with (out / "quotes.csv").open("w", newline="", encoding="utf-8-sig") as handle:
        writer = csv.DictWriter(handle, fieldnames=fields)
        writer.writeheader()
        for q in quotes:
            row = dict(zip(fields, [q["symbol"], q.get("last_price"), q.get("timestamp"),
                                   iso_ms(q.get("timestamp")), received]))
            writer.writerow(row)
            print(json.dumps(row, ensure_ascii=False))
    fields = ["time", "open", "high", "low", "close", "volume", "quote_volume"]
    with (out / "kline.csv").open("w", newline="", encoding="utf-8-sig") as handle:
        writer = csv.DictWriter(handle, fieldnames=fields, extrasaction="ignore")
        writer.writeheader()
        writer.writerows(bars)
    metadata = {"received_time_utc": received, "history_received_time_utc": history_received,
                "history_symbol": args.history_symbol, "interval": "1d", "adjust": "forward",
                "quote_rows": len(quotes), "kline_rows": len(bars),
                "last_bar_may_be_forming": True}
    (out / "run.json").write_text(json.dumps(metadata, indent=2), encoding="utf-8")
    print(f"Saved {len(quotes)} quotes and {len(bars)} K-lines to {out}")


if __name__ == "__main__":
    try:
        main()
    except (RuntimeError, ValueError, TypeError, OSError) as exc:
        print(f"Failed: {exc}", file=sys.stderr)
        sys.exit(1)
The parameter adjust="forward" selects the provider's named adjustment mode. Review the adjustment definition for your intended analysis rather than assuming that every provider uses the same terminology or scaling.
Step 4: Enter your key and run the script
From the script's directory, use this command to enter the key without placing it in the source file or shell command:
python3 -c 'import getpass,os,runpy;os.environ["TICKDB_API_KEY"]=getpass.getpass("TickDB API Key: ");runpy.run_path("tickdb_start.py",run_name="__main__")'
The command places the credential in this Python process's environment. Use a local terminal that supports hidden input. If your installation uses python rather than python3, adjust the command accordingly.
If you already supply TICKDB_API_KEY through your own local configuration, run:
python3 tickdb_start.py --out tickdb_run_001
Use a new --out directory for another run. Check symbol formats and access before changing markets. The program reads data and does not submit orders.
Step 5: Inspect the output and both timestamps
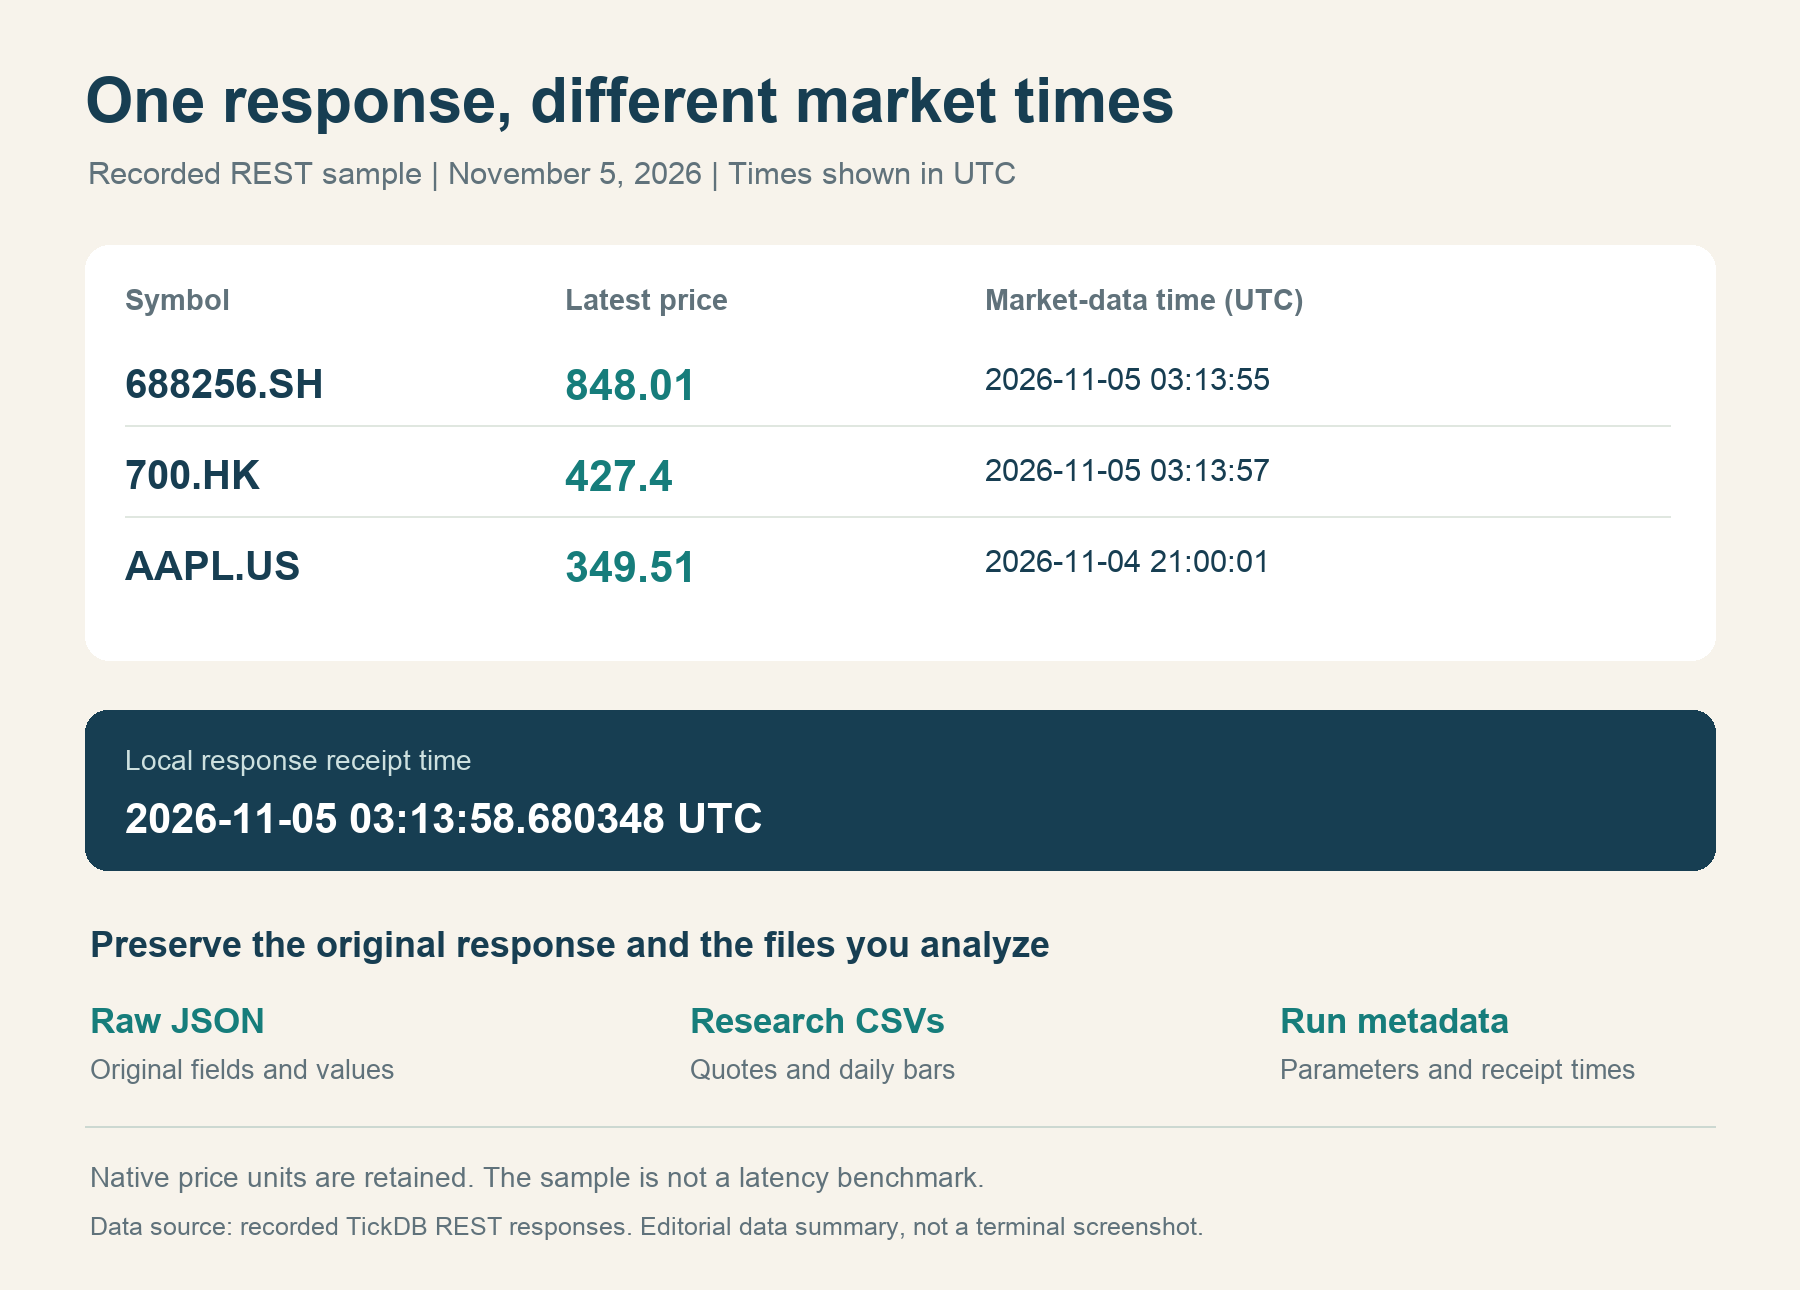
The recorded REST quote response was received at 03:13:58.680348 UTC on November 5, 2026. Prices and millisecond timestamps below retain the returned values; the final column converts the timestamps to UTC.
| Symbol | Returned latest price | Market timestamp in milliseconds | Market time in UTC |
|---|---|---|---|
688256.SH | 848.01 | 1793848435000 | 2026-11-05 03:13:55 |
700.HK | 427.4 | 1793848437000 | 2026-11-05 03:13:57 |
AAPL.US | 349.51 | 1793826001000 | 2026-11-04 21:00:01 |
The market timestamp belongs to the returned record. The receipt timestamp is recorded locally after reading the response. Their difference depends on the record's meaning, session, processing, and clock conditions; it is not a standalone network-latency measurement.
The Apple record refers to an earlier market time than the Asian-market records. Interpret it with the relevant session and price field. A cross-market response can contain records from different market times. The original price values also use their respective market quote units; they are not converted into a common currency.
The MCP and REST requests were made at different times, so Cambricon appears at 850 in the MCP sample and 848.01 in the REST sample. Both interfaces use the same service; they are two access paths, rather than independent data-source validation.
The REST daily-bar request used interval=1d and adjust=forward. The dates below are the instrument's trading dates, derived in the market's local time; OHLC fields retain the returned values.
| Trading date | Open | High | Low | Close field |
|---|---|---|---|---|
| 2026-10-30 | 882.7 | 920 | 861.89 | 880 |
| 2026-11-02 | 907.61 | 907.61 | 836 | 861 |
| 2026-11-03 | 850 | 850 | 750.01 | 767.93 |
| 2026-11-04 | 767.93 | 850 | 760 | 847.66 |
| 2026-11-05 | 815.52 | 881.88 | 812.52 | 848.01 |
The November 5 record was retrieved during the session. Use a trading calendar and session state to select completed bars for an end-of-day backtest. The script preserves the raw record and marks last_bar_may_be_forming=true in run.json.
A successful run produces five files:
| File | Purpose |
|---|---|
ticker.raw.json | Original quote response, including returned fields and values |
kline.raw.json | Original daily-bar response |
quotes.csv | Symbols, original prices, market timestamps, and receipt time |
kline.csv | Five daily bars for further spreadsheet or programmatic analysis |
run.json | Request settings, row counts, receipt times, and the current-bar flag |
CSVs are written as UTF-8 with a byte-order mark for common spreadsheet applications. Continue to check units, missing values, adjustments, and incomplete bars when turning the files into a research dataset.
Additional checks: recent trades and the order book
Two separate MCP calls were also recorded for Cambricon on November 5:
| Tool and parameters | Observed response | Use in a stock-data application |
|---|---|---|
get_recent_trades, symbol=688256.SH, type=stock, limit=3 | Three records with trade identifiers, prices, quantities, direction fields, and millisecond timestamps | Inspect recent transaction events |
get_order_book, symbol=688256.SH, type=stock | Five bid levels and five ask levels, with a timestamp | Inspect the returned order-book snapshot |
These calls were a separate batch from the earlier quote and CSV run. For a multi-year trade-and-quote archive or order-by-order replay, confirm the specific historical product and delivery scope.
Step 6: Extend the sample to your actual project
| Next deliverable | Work to add |
|---|---|
| Recurring research CSV | Historical range, pagination or chunking, adjustments, incremental updates, and completed-bar selection |
| Watchlist price cards | Security names, currencies, session state, and stale-data indicators |
| Intraday alerts | Polling or subscriptions, connection handling, duplicates, recovery, and alert state |
| AI research assistant | Stable tool parameters, saved responses and times, and separation of data from interpretation |
| Customer-facing deployment | Appropriate display use, capacity, failure handling, and operating support |
The recorded queries establish the results shown here. Long-running streaming behavior, load capacity, and the full historical boundaries of every product remain separate evaluation tasks.
If a run fails, start with the stage that failed:
| Symptom | First check |
|---|---|
Set TICKDB_API_KEY before running | Whether this process actually received the environment variable |
| HTTP or business error | Key, market and symbol access, rate limits, and the returned error; keep credentials out of public logs |
| A requested security is missing | Symbol convention, supported scope, account entitlements, and raw response |
| Empty or insufficient history | Interval, historical access, and request conditions |
| Output folder already exists | Choose a new --out path and retain the earlier sample |
6. Reusable requirements and acceptance checklists
Write the requirement before requesting samples
Copy this into a project brief:
Feature or output to deliver:
Audience: personal / internal team / external customers
Target markets and security list:
Fields and data types: quotes / bars / financials / events / other
Update or trigger rule: periodic latest value / events within the interval
Historical range, interval, and adjustment convention:
Need historical financial disclosures and revision versions?
Symbol count, batch size, operating hours, and estimated usage:
Storage, display, distribution, or other intended use:
Observable result required for the trial to pass:
Compare the cost of the workload
Use a common time period and separate account or seat costs, content and market subscriptions, usage and connections, intended-use arrangements, and development and maintenance. Keep one-time engineering effort distinct from monthly data costs.
Updating 100 symbols every minute can mean one batch request or many individual requests. A provider may meter requests, data points, bytes, connections, or subscriptions. Fewer requests do not necessarily reduce the bill or improve speed in the same proportion.
For quote-based institutional products, request an offer against the same markets, frequency, and use. Leaving a price as “requires a quote” is more useful than inventing a retail number.
Test the same requirement with each candidate
| Acceptance area | What to specify and retain |
|---|---|
| Markets and securities | Markets, instrument types, and active/inactive samples where required |
| Data and frequency | Last trades, bid/ask quotes, minute bars, daily bars, financials, or event data as separate requirements |
| History and adjustments | Dates, intervals, adjustment convention, corporate actions, and data versions |
| Financial timing | Reporting period, disclosure time, revision time, and the point at which the value can be used |
| Time and calendars | Timestamp units, time zones, trading dates, and regular or extended sessions |
| Workload | Symbol counts, batch sizes, request frequency, connections, and subscriptions |
| Output quality | Missing and duplicate records, identifier mapping, units, anomalies, and corrections |
| Failure and recovery | How network errors, missing entitlements, limits, and disconnects are detected and handled |
| Intended use | Personal use, internal teams, customer display, redistribution, and AI use |
| Cost and support | Chargeable products, accounts, markets, and uses, plus support arrangements |
Replace “real-time data for 500 stocks” with a named market, an explicit instrument list, a quote definition, a trading session, and an audience. A public app also needs the customer-display requirement in the brief.
Keep a short acceptance record:
Candidate product and plan:
Test date, software version, and account entitlements:
Markets, securities, and test period:
Request parameters, expected fields, and intended use:
Actual results, missing records, or anomalies:
Raw files and processing scripts:
Confirmed items and questions awaiting the provider:
Decision: continue trial / narrow scope / exclude
Essential conditions come first, followed by cost and developer experience. Record unpublished conditions as questions to resolve, rather than assigning an unsupported capability or a zero score.
7. Reference: the definitions that change a data decision
Data service, software library, research platform, or brokerage connection?
A data service delivers content. A software library helps retrieve or process it. A research platform combines datasets with an analysis environment. A brokerage connection can add accounts, orders, and executions.
Separate what the provider supplies from what your application must build. Installing a library or SDK does not establish access to every upstream dataset. These components can be combined in different ways; there is no single mandatory architecture.
Last trade, bid/ask quote, tick data, or OHLCV bars?
A last trade reports a completed transaction. A bid/ask quote represents buying and selling interest at a point in time, within its stated venue or coverage. Trade-level data preserves individual transactions. A bar summarizes a period as open, high, low, close, and volume.
For spreads, execution analysis, or order-book research, ask which event types and venues are included. Distinguish recent trades, a historical trade download, and order-by-order data. Each may be described with “tick” terminology while delivering different information.
What does real-time actually mean?
Check three dimensions separately:
| Dimension | Examples | What it tells you |
|---|---|---|
| Timeliness | Real-time, delayed, end-of-day | When information is made available |
| Coverage | A particular venue or consolidated market coverage | Which activity the feed represents |
| Delivery | Periodic snapshots or an event stream | How your application receives updates |
WebSocket describes a delivery mechanism; it does not establish consolidated coverage. REST can serve timely snapshots. Choose the behavior that fits your trigger: an occasional latest value or every relevant event.
Keep both market and receipt timestamps. During a closed session, the latest transaction may belong to the previous session. An HTTP response arriving now does not mean the underlying transaction happened now.
Point-in-time data, historical universes, and adjustments
A historical backtest needs a definition of which securities could be selected and what information was available at each decision time. Using today's surviving stocks to represent a historical market can change the sample. Studying a fixed present-day list is a different design and should be described as such.
Consider a hypothetical financial statement with a September 30 reporting period, an October 28 release, and a November 4 correction. A signal dated October 30 can use the version already released, but not the later correction. If the release occurred after market close, the first usable trading time also depends on the strategy and session.
A fixed reporting lag is an approximation. It does not reconstruct each company's actual disclosure and revision history. S&P Global Market Intelligence's 2019 paper, Point-In-Time – What's the Fuss About?, uses a financial-restatement case to illustrate why initially reported and revised values can differ. Use the example to understand versioning, rather than to infer a universal strategy-performance effect.
Price adjustments require their own definitions. A split can rescale historical absolute prices; dividends and other actions can be handled differently by different series. Whether that changes your signal depends on the model's use of prices, quantities, and information timing. Record the query date, adjustment parameters, and available factors or versions. An adjusted close should not be assumed to be a total-return series without checking the definition.
Free access, quotas, and data usage
“Free” may refer to open-source software, a limited request allowance, selected securities, a trial, or a restricted historical range. Calculate usage in the unit the product actually meters.
If a query can return 20 symbols and you need 100, each refresh requires at least five requests. Multiply by the operating schedule, then account for historical backfills and retries. Data-point or volume-based pricing needs its own calculation.
Finally, describe the use: personal analysis, internal research, customer display, redistribution, and AI integration may have different conditions. Evaluate the software license, data rights, and operating suitability as separate parts of the decision.
8. Frequently asked questions
Is there a free stock API?
There are open-source tools, free request plans, and trials. AKShare and BaoStock are research starting points in the directory; commercial services may offer limited access to particular products. Check the required market, fields, allowance, and intended use. Free software, free data, and permission to redistribute data are separate questions.
Which stock API should I choose?
Start with the task. Historical research needs appropriate prices and fundamentals; rigorous backtests need historical universes and information timing; intraday applications need suitable updates and recovery; order workflows need the relevant brokerage access. Use the directory to select two or three candidates and test the same requirement with each.
What should an international developer know about China A-shares?
China A-shares are mainland-listed equities, a distinct market from Hong Kong-listed or US-listed shares. Check the provider's symbol convention, sessions, adjustment definitions, and data fields for the intended market. A common API can reduce integration differences while the underlying market conventions remain important. The example uses 688256.SH as a specific Shanghai-listed security, rather than treating every China-related ticker as interchangeable.
Can I use a Sina Finance or Tencent webpage endpoint in a commercial product?
Community scripts may reference an internal webpage endpoint or an address whose behavior has changed. Look for official documentation, authentication, supported content, and terms covering your use. Treat a working webpage request as a technical observation, not an established commercial data arrangement.
Is a Tonghuashun interface the same thing as iFinD?
Tonghuashun's iFinD products have specific data interfaces and entitlements. A third-party reference to a “Tonghuashun API” may describe a different product or connection. Confirm the actual product, markets, fields, and account access before integrating it.
Can free historical prices support a valid backtest?
They can support learning and an initial research workflow. A credible historical study also depends on universe construction, adjustments, disclosure timing, missing-data treatment, costs, and execution assumptions. Evaluate those inputs for the strategy you are testing.
Should I use Python or MCP?
Use a fixed program for recurring batches, CSV exports, and application processing. MCP can let a compatible AI client request and organize data interactively. They can work together: a model helps specify the task, a program performs repeatable processing, and original responses remain available for checking. Streaming data consumption needs its own design.
Can one API cover research, trading, and a complete financial app?
One data service can support several use cases, while a research environment, a brokerage account, and a customer application add different functions. List the supplied data and the remaining application work separately so that the integration plan is clear.
Product information was reviewed on November 5, 2026, using the relevant official documentation and SDK materials. Access and permitted use depend on the selected product and account. This guide is for data selection and software development, not investment advice.